
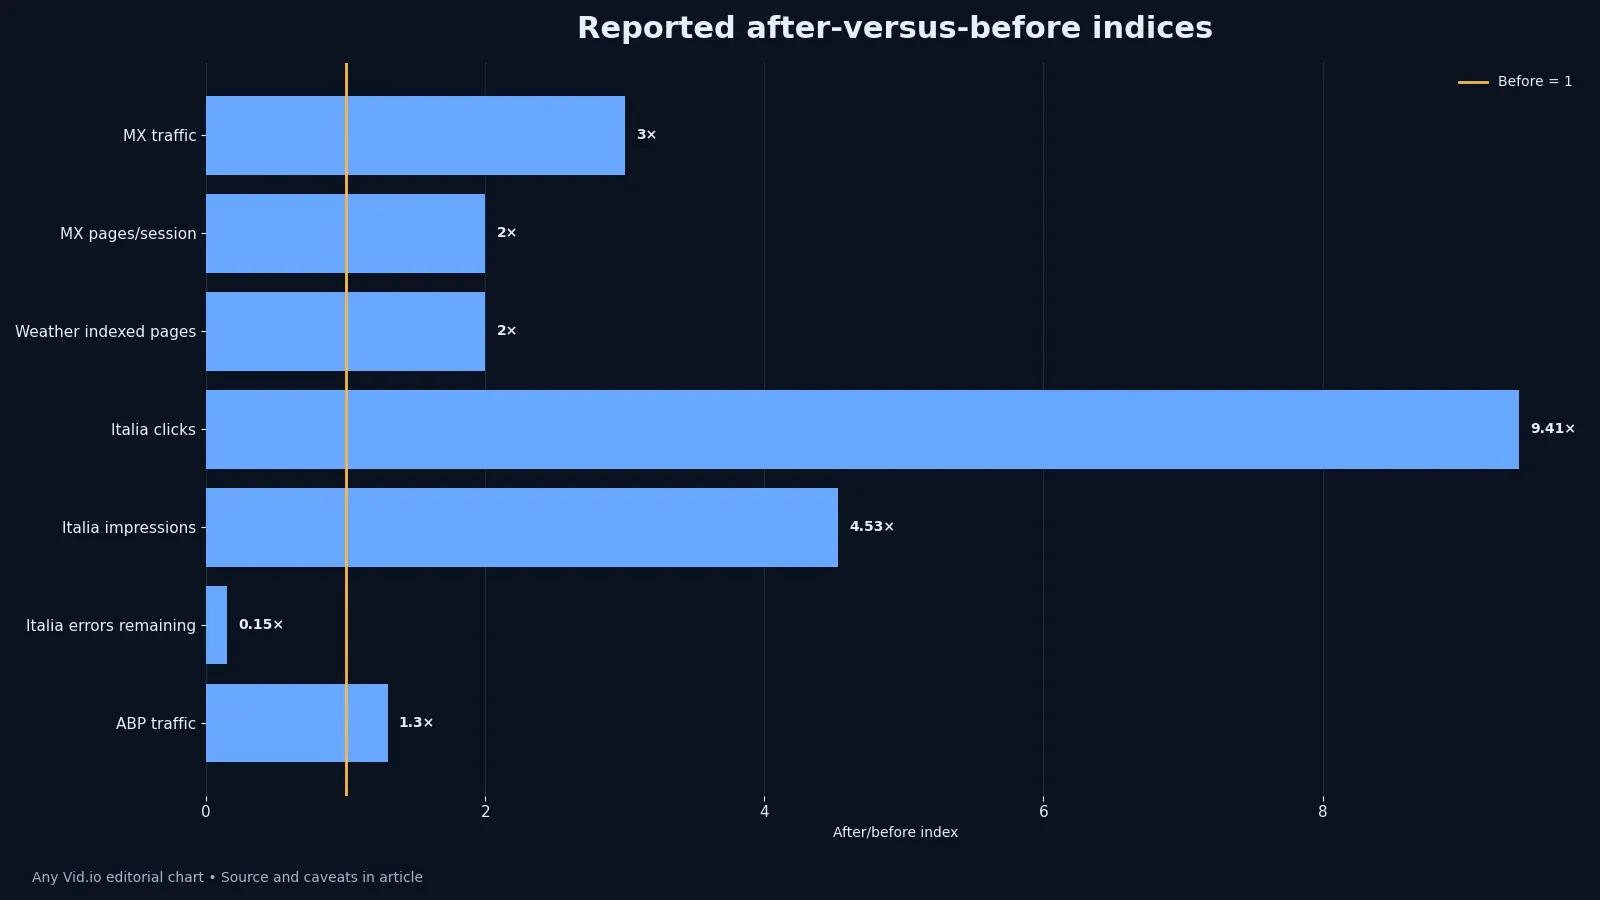
Google’s public case studies provide a rare set of concrete video-search outcomes: MX Player reported more than three times the Google traffic and a 100% increase in video page views per organic session over six months; Weather.com more than doubled indexed video pages; Italiaonline reported an 841% increase in video clicks, a 353% increase in impressions and an 85% decrease in video indexing errors; ABP News reported 30% Google traffic growth.
These are publisher-reported outcomes presented by Google, not a controlled experiment and not promises for a creator blog. Their value lies in the repeated implementation pattern: make video pages indexable, add accurate structured data, submit video sitemaps where appropriate, use Search Console reports, and fix concrete indexing errors. This article normalizes the numbers for visibility while refusing to compare unlike metrics as a leaderboard.
Normalize the reported outcomes with care
Set every before value to 1 and translate a 100% increase to 2, 30% growth to 1.3 and 841% growth to 9.41. Success should be visible in the work as well as the dashboard. A cleaner page should be easier to inspect; a stronger disclosure should be harder to miss; a better edit should answer the viewer sooner. When a metric rises but the audience experience becomes less accurate or less accessible, the experiment has found a trade-off, not an uncomplicated win.
Keep ‘more than 2x’ and ‘more than 3x’ marked as lower bounds rather than exact endpoints. Document the unsuccessful pass too. Rejected versions show which constraints mattered and stop the team from repeating an attractive mistake six weeks later. A useful record needs the date, source material, decision owner, changed element, observation window and one sentence about uncertainty. That is enough structure for learning without building a bureaucracy.
Chart indexing, clicks, traffic and pages per session together only as a source map, never as comparable performance scores. Treat the chart as a map of the published evidence, not a forecast. It compresses the reported values so patterns are easier to see, but it does not add precision the source never supplied. Thresholds such as ‘more than’ or ‘fewer than’ remain thresholds, and indexed pages, clicks, traffic and engagement must not be silently treated as the same outcome.
Find the common implementation work
Across the cases, accurate video structured data and indexable watch pages appear repeatedly. Before generalizing, ask what else changed at the same time. A creator may alter cadence, subject, collaboration and presentation together; a publisher may add markup while fixing indexing; a production may combine generation with conventional editing. The honest conclusion is often that the workflow bundle worked under observed conditions, while the contribution of each part remains unknown.
Video sitemaps help surface metadata and discovery paths, especially for larger or frequently changing catalogs. The next test should be cheaper than the story that inspired it. Use existing footage, a limited archive, a single sponsor brief or a short run of posts. Decide in advance what would make you stop, continue or revise. Pre-committing to those choices reduces the temptation to explain every noisy result as proof that the idea was right.
Search Console’s video indexing, rich result and performance reports create a feedback loop between implementation and observed coverage. Finally, preserve editorial judgment. Data can expose a pattern and a case can demonstrate feasibility, but neither can decide what is responsible for your audience, sustainable for your capacity or consistent with your voice. The creator still owns that decision—and should be able to explain it without hiding behind an algorithm or a benchmark.
Start with one strong watch page
Place a useful, prominent video on a page that has its own explanatory purpose and stable URL. The important distinction is between what the record establishes and what an editor might infer. A published outcome can show that a particular team changed a particular system; it cannot prove that copying one visible tactic will reproduce the number. Use the evidence to choose a test, then measure that test against your own baseline.
Give the page a descriptive title, supporting text, thumbnail and metadata that agree about the same video. In practice, turn that observation into a written decision before opening the camera or editor. Name the audience question, the asset that will answer it, and the signal that would justify keeping the change. This keeps a striking result from becoming a vague command to ‘do more’ and gives collaborators something concrete to challenge.
Avoid thin pages that exist only to embed a player without helping the viewer understand or use the material. The failure mode is easy to recognize: the headline number survives while the conditions disappear. Sample size, time window, content library, distribution surface and measurement definition all shape the result. Keep those conditions beside the metric in the project notes, especially when the source is a platform, vendor or company describing its own success.
Implement accurate structured data
Use Google’s current VideoObject documentation and include only properties supported by the visible page and actual media. A small creator can still use the lesson without imitating the scale. Reduce the operation to one page, one video family or one campaign. Establish the current state, change one coherent bundle of decisions, and wait long enough for the relevant behavior to occur. If several variables move together, describe the result as a package rather than crediting a favorite detail.
Keep thumbnail, upload date, duration, description and content or embed URLs accurate and accessible to crawlers. Success should be visible in the work as well as the dashboard. A cleaner page should be easier to inspect; a stronger disclosure should be harder to miss; a better edit should answer the viewer sooner. When a metric rises but the audience experience becomes less accurate or less accessible, the experiment has found a trade-off, not an uncomplicated win.
Validate markup, but remember that valid structured data makes a page eligible rather than guaranteeing a rich result. Document the unsuccessful pass too. Rejected versions show which constraints mattered and stop the team from repeating an attractive mistake six weeks later. A useful record needs the date, source material, decision owner, changed element, observation window and one sentence about uncertainty. That is enough structure for learning without building a bureaucracy.
Monitor indexing as a production system
Record valid video pages, excluded pages, error types and changes by template release. Treat the chart as a map of the published evidence, not a forecast. It compresses the reported values so patterns are easier to see, but it does not add precision the source never supplied. Thresholds such as ‘more than’ or ‘fewer than’ remain thresholds, and indexed pages, clicks, traffic and engagement must not be silently treated as the same outcome.
Investigate whether the intended video is prominent and whether Google can fetch thumbnails and media URLs. Before generalizing, ask what else changed at the same time. A creator may alter cadence, subject, collaboration and presentation together; a publisher may add markup while fixing indexing; a production may combine generation with conventional editing. The honest conclusion is often that the workflow bundle worked under observed conditions, while the contribution of each part remains unknown.
Annotate deployments so a later increase or decline can be matched to actual technical work. The next test should be cheaper than the story that inspired it. Use existing footage, a limited archive, a single sponsor brief or a short run of posts. Decide in advance what would make you stop, continue or revise. Pre-committing to those choices reduces the temptation to explain every noisy result as proof that the idea was right.
Apply the lesson at creator scale
Audit five evergreen tutorials before building automation for an entire archive. Finally, preserve editorial judgment. Data can expose a pattern and a case can demonstrate feasibility, but neither can decide what is responsible for your audience, sustainable for your capacity or consistent with your voice. The creator still owns that decision—and should be able to explain it without hiding behind an algorithm or a benchmark.
Connect each video page to a real search intent and a useful text explanation. The important distinction is between what the record establishes and what an editor might infer. A published outcome can show that a particular team changed a particular system; it cannot prove that copying one visible tactic will reproduce the number. Use the evidence to choose a test, then measure that test against your own baseline.
Use a sitemap generator only after checking that it does not publish stale, blocked or mismatched metadata. In practice, turn that observation into a written decision before opening the camera or editor. Name the audience question, the asset that will answer it, and the signal that would justify keeping the change. This keeps a striking result from becoming a vague command to ‘do more’ and gives collaborators something concrete to challenge.
Interpret the result without overclaiming
Organic traffic can change because of demand, seasonality, content, competition and product changes alongside technical SEO. The failure mode is easy to recognize: the headline number survives while the conditions disappear. Sample size, time window, content library, distribution surface and measurement definition all shape the result. Keep those conditions beside the metric in the project notes, especially when the source is a platform, vendor or company describing its own success.
A reduction in indexing errors is an operational success even before clicks move. A small creator can still use the lesson without imitating the scale. Reduce the operation to one page, one video family or one campaign. Establish the current state, change one coherent bundle of decisions, and wait long enough for the relevant behavior to occur. If several variables move together, describe the result as a package rather than crediting a favorite detail.
Compare Search Console performance by page group and query intent rather than treating sitewide traffic as proof of one tag. Success should be visible in the work as well as the dashboard. A cleaner page should be easier to inspect; a stronger disclosure should be harder to miss; a better edit should answer the viewer sooner. When a metric rises but the audience experience becomes less accurate or less accessible, the experiment has found a trade-off, not an uncomplicated win.
Build a six-week audit
Week one records the baseline; weeks two and three fix accessibility and markup; later weeks observe recrawling and coverage. Document the unsuccessful pass too. Rejected versions show which constraints mattered and stop the team from repeating an attractive mistake six weeks later. A useful record needs the date, source material, decision owner, changed element, observation window and one sentence about uncertainty. That is enough structure for learning without building a bureaucracy.
Keep an untreated comparison group when the site has enough similar pages, while acknowledging that it is not randomized. Treat the chart as a map of the published evidence, not a forecast. It compresses the reported values so patterns are easier to see, but it does not add precision the source never supplied. Thresholds such as ‘more than’ or ‘fewer than’ remain thresholds, and indexed pages, clicks, traffic and engagement must not be silently treated as the same outcome.
Decide whether to expand based on implementation reliability, indexing coverage and useful visits—not only impressions. Before generalizing, ask what else changed at the same time. A creator may alter cadence, subject, collaboration and presentation together; a publisher may add markup while fixing indexing; a production may combine generation with conventional editing. The honest conclusion is often that the workflow bundle worked under observed conditions, while the contribution of each part remains unknown.
Evidence table
| Publisher | Reported implementation/result | Important limitation |
|---|---|---|
| MX Player | >3× Google traffic; +100% video pages/session over 6 months | Large streaming catalog |
| Weather.com | >2× indexed video pages | Indexing outcome, not traffic |
| Italiaonline | +841% clicks; +353% impressions; −85% indexing errors | Multiple domains and publisher scale |
| ABP News | +30% Google traffic across 8 languages | Regional news corpus |
This evidence table for Video SEO at Scale: What Four Publisher Case Studies Actually Show is deliberately compact. It preserves the unit and limitation beside each result so the number cannot wander into a slide deck as an unsupported universal benchmark. For a working analysis, add the date you accessed the source and the exact metric definition used in your own account.
Source and method
This case study relies on Google Search Central video SEO case studies. The chart redraws only values stated by that source or transparent transformations described in its caption. No private dashboard data, invented survey, simulated outcome or scraped personal information is presented as fact.
For this Video SEO analysis, any interest held by a platform or company reporting its own result is named; academic designs and dates remain visible. The source link lets readers inspect the original wording, while current feature or legal questions should still be checked against current primary guidance before action.
Apply the case without copying it
Choose one bounded project and write a baseline before making changes. Preserve the case’s logic—clear variables, visible evidence and honest limitations—without imitating its scale or headline outcome. Read Film Searchable Short-Form Tutorials That Answer One Question Well. Read Refresh Evergreen Video Pages Without Losing What Already Works. Read MP4, WebM, MOV and Codecs.
Review the Video SEO result with the people who make and use the content. Keep what improves clarity, trust or sustainable production; revise what merely chases the published number. Browse the AnyVid.io blog for more creator workflows. When archiving reference media, use only media you created, own, or have permission or another lawful right to save.
Frequently asked questions
Does VideoObject markup guarantee a video rich result?
No. Correct structured data can make a page eligible, but Google does not guarantee display. The page, video, thumbnail and URLs also need to be accessible and consistent. Follow current documentation and monitor Search Console.
Why normalize results to a baseline of one?
Normalization lets readers see relative change when raw counts are private. It does not make different metrics comparable. An indexed-page multiplier and a click multiplier answer different questions and should remain labeled.
Can a seven-page creator site use these lessons?
Yes, at a smaller scale. Start with a few valuable watch pages, accurate metadata, crawlable media and Search Console. A small site may not need elaborate sitemap automation, but it still benefits from clear page purpose and technical checks.
How quickly should video SEO changes work?
There is no guaranteed timeline. Crawling, indexing, demand and competition vary. MX Player’s published outcome used a six-month window; that is context, not a universal waiting period. Track technical coverage before expecting traffic changes.
Should every embedded video have its own page?
Only when the page has independent value and the video is central. Avoid creating thin near-duplicate pages for every clip. Group or embed material where that better serves the user, and reserve watch pages for clear intents.
Was this article helpful?
Tell us what worked so we can improve future content.