
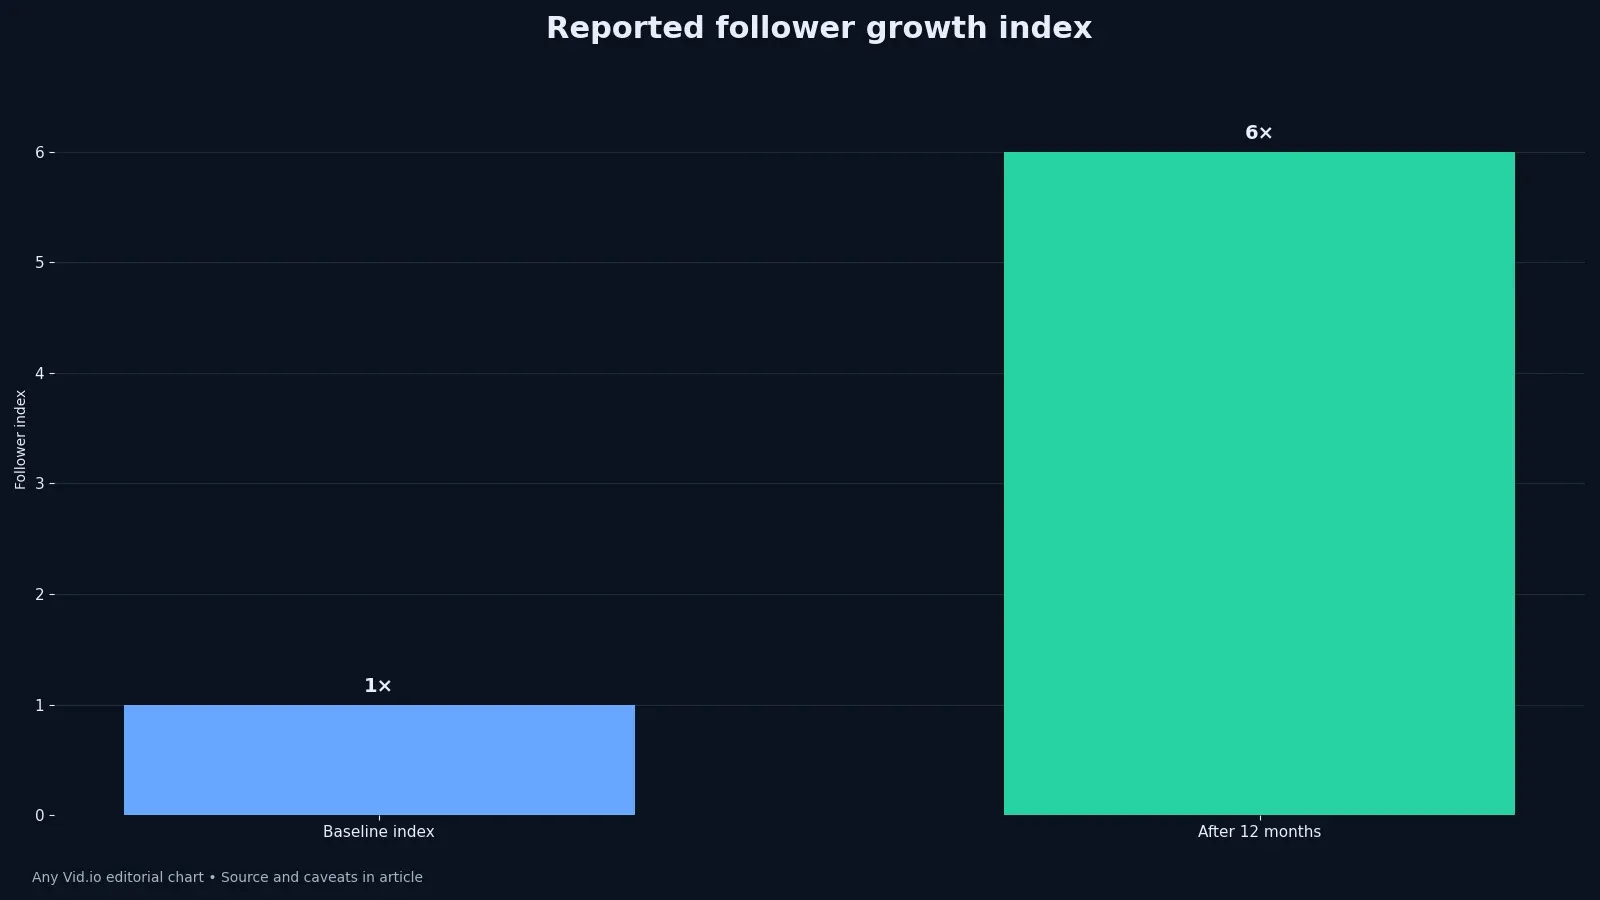
Instagram’s profile of baseball creator Jackson Olson is unusually useful because it gives both an outcome and a visible operating idea: post Reels consistently, build recurring formats, collaborate, and keep the subject tied to a recognizable world. Instagram reported that Olson’s follower count grew sixfold over 12 months. It did not publish raw starting and ending counts, a control group or a causal breakdown.
That makes this a case study in disciplined interpretation. The result is real as reported by the platform, but ‘post daily and grow 6x’ would be a false promise. This analysis reconstructs the workflow a creator can test: a sustainable series engine, recognizable roles for collaborators, repeatable capture, and a measurement plan that does not confuse cadence with quality.
Read the reported result precisely
Set the baseline follower index to 1 and the reported 12-month index to 6; do not invent raw follower totals. The important distinction is between what the record establishes and what an editor might infer. A published outcome can show that a particular team changed a particular system; it cannot prove that copying one visible tactic will reproduce the number. Use the evidence to choose a test, then measure that test against your own baseline.
Record that Instagram published the profile in May 2023 and described a 12-month window. In practice, turn that observation into a written decision before opening the camera or editor. Name the audience question, the asset that will answer it, and the signal that would justify keeping the change. This keeps a striking result from becoming a vague command to ‘do more’ and gives collaborators something concrete to challenge.
Separate the platform’s verified report from assumptions about reach, revenue or conversion, none of which the case publishes. The failure mode is easy to recognize: the headline number survives while the conditions disappear. Sample size, time window, content library, distribution surface and measurement definition all shape the result. Keep those conditions beside the metric in the project notes, especially when the source is a platform, vendor or company describing its own success.
Reconstruct the content system
Olson’s baseball setting supplies a durable subject, recognizable props and a steady stream of situations rather than isolated trend chasing. A small creator can still use the lesson without imitating the scale. Reduce the operation to one page, one video family or one campaign. Establish the current state, change one coherent bundle of decisions, and wait long enough for the relevant behavior to occur. If several variables move together, describe the result as a package rather than crediting a favorite detail.
Recurring concepts reduce blank-page work because each post starts from a known promise and varies the event, collaborator or payoff. Success should be visible in the work as well as the dashboard. A cleaner page should be easier to inspect; a stronger disclosure should be harder to miss; a better edit should answer the viewer sooner. When a metric rises but the audience experience becomes less accurate or less accessible, the experiment has found a trade-off, not an uncomplicated win.
Collaboration is part of the format, not merely distribution; another person creates conflict, surprise and a reason for the scene to move. Document the unsuccessful pass too. Rejected versions show which constraints mattered and stop the team from repeating an attractive mistake six weeks later. A useful record needs the date, source material, decision owner, changed element, observation window and one sentence about uncertainty. That is enough structure for learning without building a bureaucracy.
Test cadence without manufacturing burnout
Daily publishing was part of the reported case, but the useful variable is a dependable production cycle the creator can actually sustain. Treat the chart as a map of the published evidence, not a forecast. It compresses the reported values so patterns are easier to see, but it does not add precision the source never supplied. Thresholds such as ‘more than’ or ‘fewer than’ remain thresholds, and indexed pages, clicks, traffic and engagement must not be silently treated as the same outcome.
Batch repeatable setup work while keeping enough slack for timely baseball moments and genuine reactions. Before generalizing, ask what else changed at the same time. A creator may alter cadence, subject, collaboration and presentation together; a publisher may add markup while fixing indexing; a production may combine generation with conventional editing. The honest conclusion is often that the workflow bundle worked under observed conditions, while the contribution of each part remains unknown.
Set a four-week test with a maximum weekly workload; abandon frequency increases that damage accuracy, health or audience trust. The next test should be cheaper than the story that inspired it. Use existing footage, a limited archive, a single sponsor brief or a short run of posts. Decide in advance what would make you stop, continue or revise. Pre-committing to those choices reduces the temptation to explain every noisy result as proof that the idea was right.
Design three complementary series
Use one dependable teaching or behind-the-scenes series, one collaboration format and one timely response format. Finally, preserve editorial judgment. Data can expose a pattern and a case can demonstrate feasibility, but neither can decide what is responsible for your audience, sustainable for your capacity or consistent with your voice. The creator still owns that decision—and should be able to explain it without hiding behind an algorithm or a benchmark.
Give every series a stable opening expectation while varying the evidence and payoff so the feed does not become mechanical. The important distinction is between what the record establishes and what an editor might infer. A published outcome can show that a particular team changed a particular system; it cannot prove that copying one visible tactic will reproduce the number. Use the evidence to choose a test, then measure that test against your own baseline.
Retire a series when the premise is exhausted, even if the template remains easy to produce. In practice, turn that observation into a written decision before opening the camera or editor. Name the audience question, the asset that will answer it, and the signal that would justify keeping the change. This keeps a striking result from becoming a vague command to ‘do more’ and gives collaborators something concrete to challenge.
Measure a small creator test
Track median reach, follows per reached account, saves or shares when available, production time and creator energy by series. The failure mode is easy to recognize: the headline number survives while the conditions disappear. Sample size, time window, content library, distribution surface and measurement definition all shape the result. Keep those conditions beside the metric in the project notes, especially when the source is a platform, vendor or company describing its own success.
Compare like with like: similar topic families, observation windows and distribution conditions. A small creator can still use the lesson without imitating the scale. Reduce the operation to one page, one video family or one campaign. Establish the current state, change one coherent bundle of decisions, and wait long enough for the relevant behavior to occur. If several variables move together, describe the result as a package rather than crediting a favorite detail.
Review distributions and outliers rather than allowing one exceptional post to define the whole month. Success should be visible in the work as well as the dashboard. A cleaner page should be easier to inspect; a stronger disclosure should be harder to miss; a better edit should answer the viewer sooner. When a metric rises but the audience experience becomes less accurate or less accessible, the experiment has found a trade-off, not an uncomplicated win.
What the case cannot prove
The profile cannot isolate whether cadence, collaborations, baseball events, creative improvement or external attention produced the growth. Document the unsuccessful pass too. Rejected versions show which constraints mattered and stop the team from repeating an attractive mistake six weeks later. A useful record needs the date, source material, decision owner, changed element, observation window and one sentence about uncertainty. That is enough structure for learning without building a bureaucracy.
It does not establish a universal posting requirement or a growth benchmark for creators in other niches. Treat the chart as a map of the published evidence, not a forecast. It compresses the reported values so patterns are easier to see, but it does not add precision the source never supplied. Thresholds such as ‘more than’ or ‘fewer than’ remain thresholds, and indexed pages, clicks, traffic and engagement must not be silently treated as the same outcome.
It does show that a recognizable content world can make frequent publishing more coherent than seven unrelated ideas. Before generalizing, ask what else changed at the same time. A creator may alter cadence, subject, collaboration and presentation together; a publisher may add markup while fixing indexing; a production may combine generation with conventional editing. The honest conclusion is often that the workflow bundle worked under observed conditions, while the contribution of each part remains unknown.
Build the production board
Create columns for premise, collaborator, location, prop, opening image, payoff, status and learning note. The next test should be cheaper than the story that inspired it. Use existing footage, a limited archive, a single sponsor brief or a short run of posts. Decide in advance what would make you stop, continue or revise. Pre-committing to those choices reduces the temptation to explain every noisy result as proof that the idea was right.
Keep permissions and releases with collaborative footage, especially when minors, private locations or sponsored material are involved. Finally, preserve editorial judgment. Data can expose a pattern and a case can demonstrate feasibility, but neither can decide what is responsible for your audience, sustainable for your capacity or consistent with your voice. The creator still owns that decision—and should be able to explain it without hiding behind an algorithm or a benchmark.
Archive only media you created, own, or have permission or another lawful right to save. The important distinction is between what the record establishes and what an editor might infer. A published outcome can show that a particular team changed a particular system; it cannot prove that copying one visible tactic will reproduce the number. Use the evidence to choose a test, then measure that test against your own baseline.
Make the decision after four weeks
Continue a series when audience signals and production cost are both acceptable, not merely because a single view count is high. In practice, turn that observation into a written decision before opening the camera or editor. Name the audience question, the asset that will answer it, and the signal that would justify keeping the change. This keeps a striking result from becoming a vague command to ‘do more’ and gives collaborators something concrete to challenge.
Revise a strong premise with weak openings before discarding the subject itself. The failure mode is easy to recognize: the headline number survives while the conditions disappear. Sample size, time window, content library, distribution surface and measurement definition all shape the result. Keep those conditions beside the metric in the project notes, especially when the source is a platform, vendor or company describing its own success.
Reduce cadence when the workflow crowds out research, recovery or the quality that made the account worth following. A small creator can still use the lesson without imitating the scale. Reduce the operation to one page, one video family or one campaign. Establish the current state, change one coherent bundle of decisions, and wait long enough for the relevant behavior to occur. If several variables move together, describe the result as a package rather than crediting a favorite detail.
Evidence table
| Published fact | What it supports | What it does not prove |
|---|---|---|
| 6× follower growth | A substantial reported change over 12 months | That daily posting alone caused the change |
| 12-month window | The outcome was not an overnight spike | The same timeline applies to another account |
| Daily Reels cadence | High-frequency publishing was part of the system | Daily posting is required by Instagram |
| Baseball-centered formats | A coherent subject world supported repetition | Every niche needs sports or collaborations |
This evidence table for How Daily Reels Changed Jackson Olson’s Instagram Growth: A Case Study is deliberately compact. It preserves the unit and limitation beside each result so the number cannot wander into a slide deck as an unsupported universal benchmark. For a working analysis, add the date you accessed the source and the exact metric definition used in your own account.
Source and method
This case study relies on Instagram Creators: How posting daily Reels helped Jackson Olson grow 6x on Instagram. The chart redraws only values stated by that source or transparent transformations described in its caption. No private dashboard data, invented survey, simulated outcome or scraped personal information is presented as fact.
For this Instagram Growth analysis, any interest held by a platform or company reporting its own result is named; academic designs and dates remain visible. The source link lets readers inspect the original wording, while current feature or legal questions should still be checked against current primary guidance before action.
Apply the case without copying it
Choose one bounded project and write a baseline before making changes. Preserve the case’s logic—clear variables, visible evidence and honest limitations—without imitating its scale or headline outcome. Read Plan an Instagram Reels Series With a Promise–Proof–Payoff Board. Read Design Instagram Reel Covers That Survive Every Crop. Read Diagnose Short-Form Video Retention Without Chasing Benchmarks.
Review the Instagram Growth result with the people who make and use the content. Keep what improves clarity, trust or sustainable production; revise what merely chases the published number. Browse the AnyVid.io blog for more creator workflows. When archiving reference media, use only media you created, own, or have permission or another lawful right to save.
Frequently asked questions
Did posting daily cause the sixfold growth?
The Instagram profile reports both daily Reels and sixfold follower growth, but it does not isolate causation. Content concepts, collaborations, events, creative improvement and external exposure may also have contributed. Treat cadence as one part of the observed system.
Should every Instagram creator post a Reel every day?
No. Choose a cadence that preserves useful ideas, safe production and honest engagement with your audience. Test a limited schedule against your baseline. A slower, repeatable system is more valuable than a daily sprint that collapses after two weeks.
Why use an index instead of follower counts?
Instagram published the multiplier but not the raw starting and ending totals. Setting the baseline to 1 and the outcome to 6 visualizes exactly what was reported without pretending to know unpublished counts.
How long should a creator run a cadence test?
Four weeks is a practical starting point for a workflow test, not a platform benchmark. It gives you several repetitions while limiting risk. Seasonal niches or low-frequency formats may need longer; define the window before reviewing results.
What is the most transferable lesson?
Build a recognizable content world with repeatable series before increasing frequency. Cadence amplifies whatever system already exists. If the premise is unclear or production is chaotic, publishing more often can simply multiply weak work.
Was this article helpful?
Tell us what worked so we can improve future content.